Inoview is the data visualisation platform used by Aquaread, designed by nke. Data transmitted from the Aquatel telemetry device is neatly displayed in historic graphs whilst the latest readings are displayed up top for a quick snap-shot of your data.
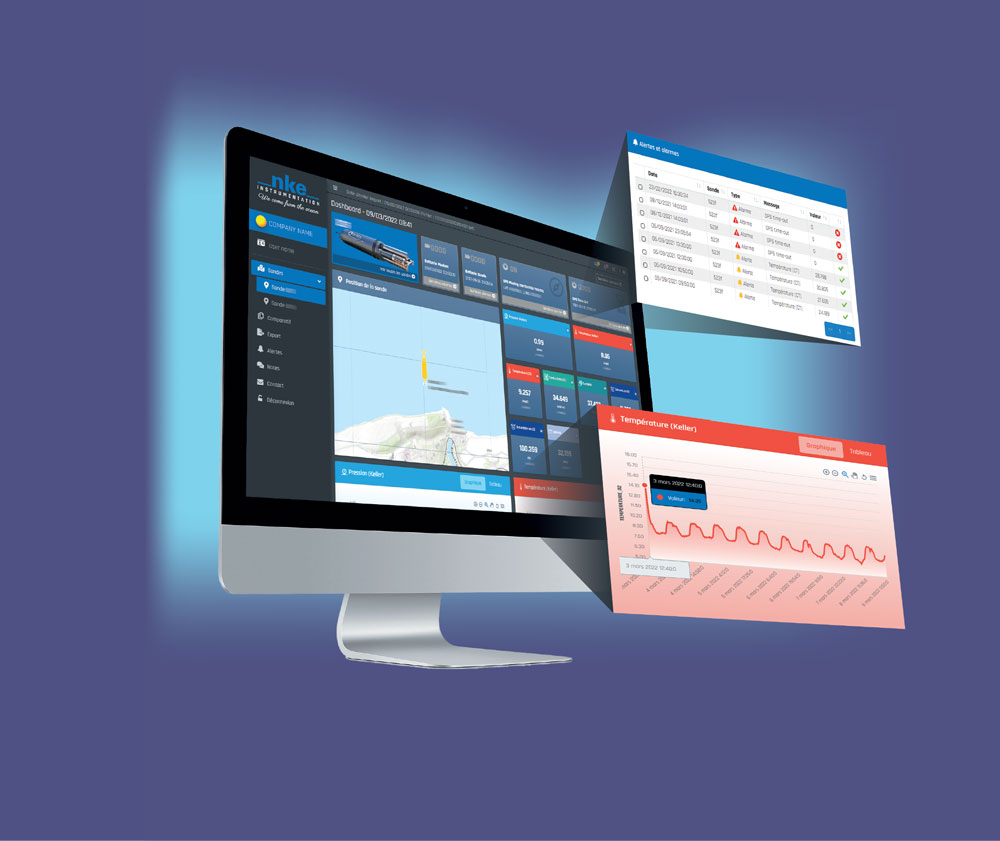
Aquatel has a built in GPS receiver, when you deploy the device you can activate this to pinpoint the GPS coordinates in order to display the units location within inoview.

Next to the map you will find the latest readings transmitted from the Aquatel, allowing you to quickly check the measurements when you first open the platform.
Found at the top of the screen are indicators for the battery status and for the cleaning status of probes deployed with a cleaning mechanism. These indicators will turn red if there is an issue to alert you when you check your data.
This is where inoview really shines. Historic graphs for all parameters are displayed, you can customise the date range to look over specific events more closely. Each graph can be fully manipulated allowing users to zoom in on specific sections of data and see the value for each individual data point.
Choosing comparative from the menu of options on the left of the screen you are taken to a page that allows you to choose specific parameters and overlay their data traces. This is particularly useful to help spot events that cause measurement changes detected by multiple sensors.
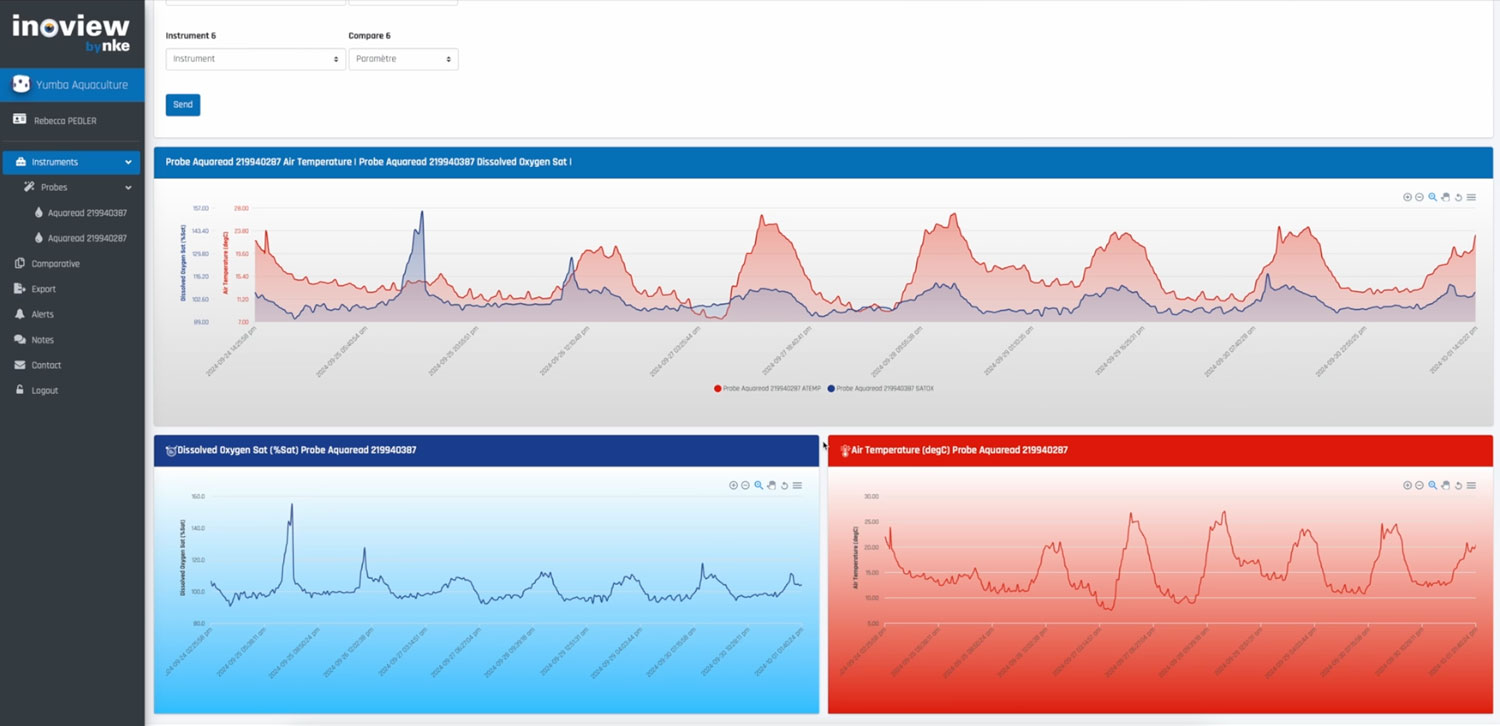
Data can be viewed as a graph or as a table. All can be exported making it easier for you to present your data effectively.
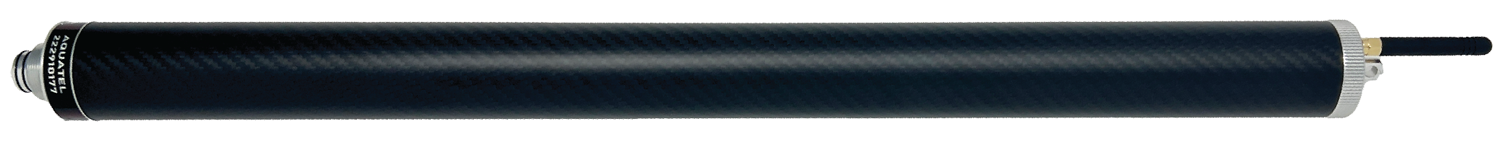
Data collected using the Aquatel telemetry device will be sent either to your own FTP server or to the Inoview web platform*
Control Aquatel with your mobile phone using SMS, request instant readings and make changes to its settings remotely with ease.
*for a small annual cost